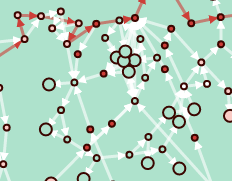
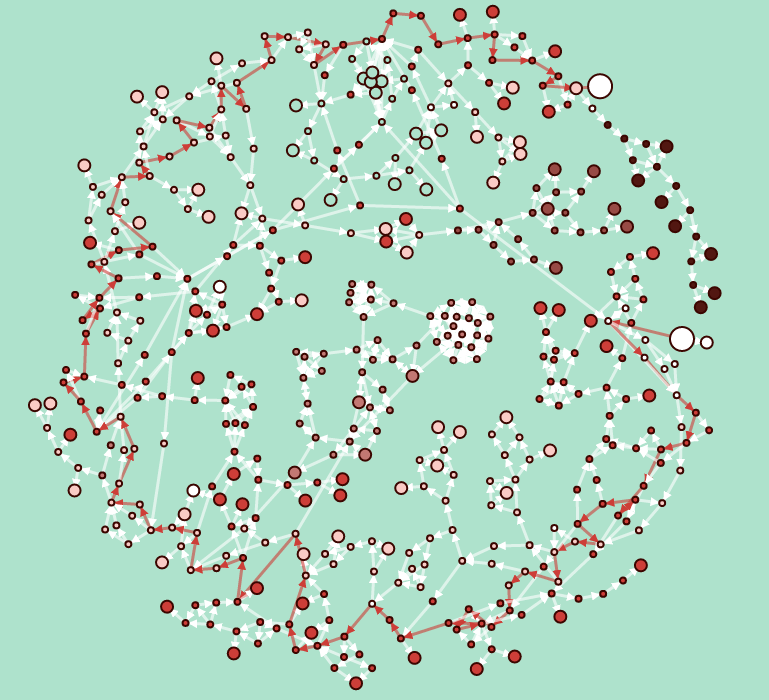
This is the second part of a series of psots about some of the technical details about how I put together a visualization of passages and choices in Ryan North’s excellent choosable path adventure, Romeo and/or Juliet. Here, we talk about designing the schema for the directed graph, gathering data, and some Sheets formulas use to help automate some mundane tasks.
Read the others about book impressions, data processing and data visualization as well.
Data Entry and/or Sheets Formulas
Data entry is a pretty straightforward task, once you’ve decided upon a how you’re planning to model the data and what tools to leverage.
Because the choices for each passage in R&|J are one-way and can refer back to earlier passages causing cycles, I used a Directed Graph to model the story. A Digraph consists of nodes (the story passages) and edges (the choices that lead you between those passages).
For passages, I recorded the passage number, a short description of the passage and also noted if it was an ending or not. For choices, I recorded the starting passage number, the destination passage number, a brief description of the passage and noted if the choice was indicated as part of the Bard Path in the book.
I decided to use Google Sheets to record the data rather than a custom tool so I’d have the flexibility to enter notes from different computers or my phone while traveling and enjoying the story. To help quality check the sheets as I entered data, I also added add a several handy formulas to check references.
Programming in Google sheets is a big ol’ parenthesis soup, but is surprisingly powerful. VLOOKUP is a pretty standard spreadsheet formula to do a 1-to-1 join of different records based upon a key, but it is also possible to join 1-to-many records into a single cell using ARRAYFORMULA.
An example of how one could use ARRAYFORMULA is shown in the below formula to concatenate all of the destination passages for choices from the current passage. For passage number 9, this gives us a result of 10; 418;, the numbers of both passages that one can move to from this passage.
=ArrayFormula(concatenate(rept(choices!B:B&"; ",choices!A:A=A10)))
Breaking it down:
REPTrepeats text the provided number of times . In this case, this function is used as a filter to include the destination passage number with a semicolon (choices!B:B&"; ") if the choice record matches with the current passage number (choices!A:A=A10), effectively repeating the passage number 0 times if the condition is not filled and 1 time if it is. A standardIFfunction can also be used instead ofREPTwith the same condition, but is slightly more verbose.CONCATENATEconcatenates the results of theREPTfunction. In our example, the result is a range including values like10;and418;.ARRAYFORMULAallows the use of ranges of cells with formula that normally don’t use ranges, such asCONCATENATEandREPT. This results in the final combined value10; 418;.
A similar formula can be used for choice descriptions or even choices which lead us to this passage. Overall this approach gives us a pretty useful and pragmatic tool for data entry with minimal coding required!
The next post for this project will be about Data Processing and Graph Theory.

