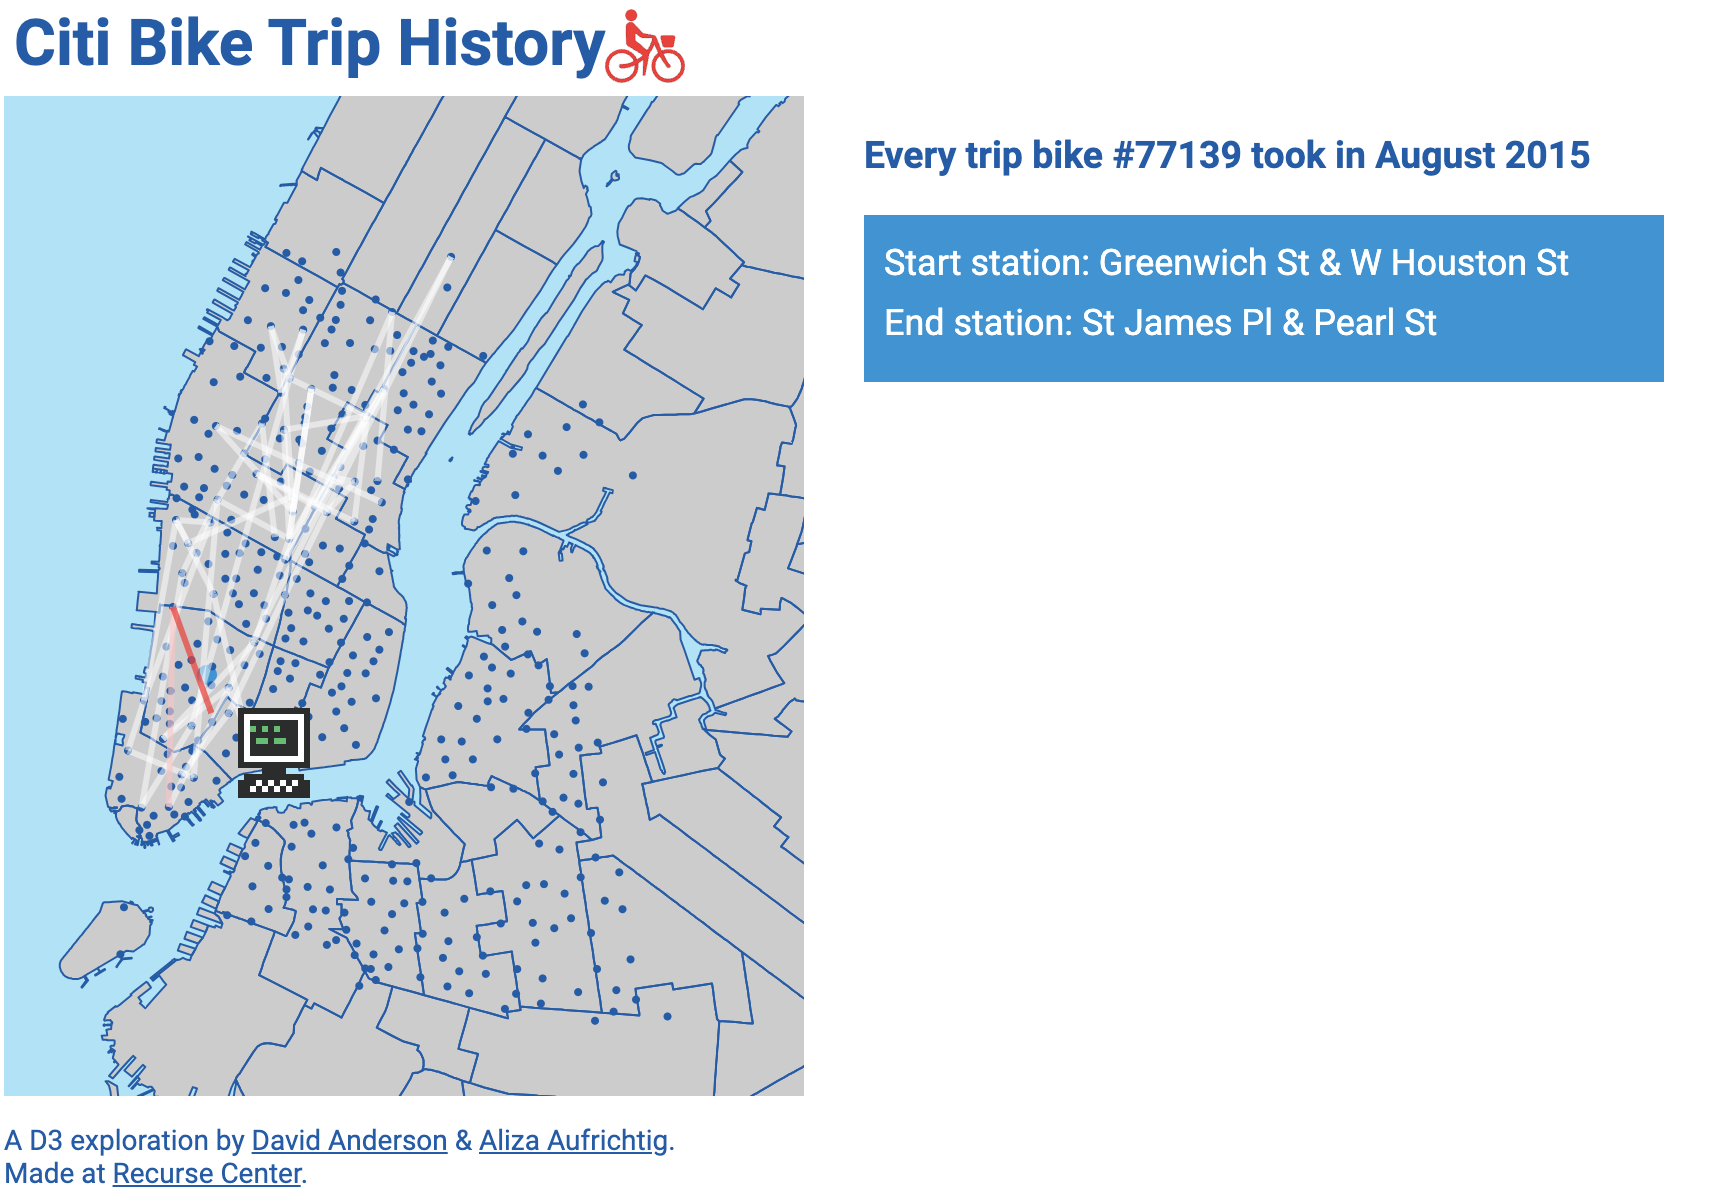
I worked through Mike Bostock’s great Let’s Make a Map D3 tutorial with Aliza at Recurse Center as a step on our project to try to render a map of NYC for our CitiBike data visualization.
Let’s Make a Map!
In Mike’s tutorial, we take Shapefile data for the UK, filter and convert the data to GeoJSON then TopoJSON. We then load the TopoJSON file in D3, covert the data back to GeoJSON and render it as SVG in the browser using a projection, with some pretty styling and labels.
This was a very illustrative starting place for how to work with map data in D3 (especially if you have a solid grasp of D3 fundamentals). However there are a few pieces of knowledge and references that can be a great aid when you’re starting to step outside the bounds of the sandboxed example.
Mapping Basics & Shapefiles
Mapschool.io provides a very readable overview of mapping basics, starting from the very beginning. This includes some great information about the structure of the Shapefile, one of the most common formats which you can find open map data in. The Shapefile format is actually a group of files which act together, but with very different contents.
- .shp
- .prj
- .shx
- .dbf
- .prj
During the Let’s Make a Map! tutorial, we filter data from our shapefile using a GIS command line tool ogr2ogr by applying filters to the database associated with the shapefile. Filters use straightforward SQL-like WHERE-clause syntax, but when you are preparing your own data, you will need to review the data in the shapefile to determine how best to filter it.
A useful program for to review shapefiles is QGIS, an open source GIS tool. You can open the file in QGIS browser easily to preview the structure and data attributes. You can also open the file in QGIS desktop and open the attribute table from the desktop.
GeoJSON and TopoJSON - Geometry vs. Topology
This site is a great reference for understanding the GeoJSON structure. For a deeper understanding of the file format, you can play with Tools such as GeoJSON.io to create and view the text contents for new GeoJSON from arbitary shapes on top of a map or mapshaper.org to load an existing Shapefile, GeoJSON or TopoJSON to get a feel for how their contents are structured visually.
It is initially counter-intuitive to consider that we are converting our map data from Shapefile format to GeoJSON then TopoJSON, only to finally covert the data back to GeoJSON on the client side to display, but there’s good reason for each format. For example, TopoJSON is a more space-efficient format which is especially beneficial for the transferring large amounts of mapping data on web.
Understanding the difference between Geometry and Topology can really help drive home what the fundamenetal differences between GeoJSON and TopoJSON.
In formats such as Shapefile and GeoJSON, the edges of the object is stored using Geometry. These file formats will store all edges separately for each shape even if there are multiple overlapping edges of shapes (say for neighboring states or countries).
In TopoJSON, there are two primary tricks used to reduce the size of the file format. First, the edges of an object are stored as topology. This means that each object is stored as a reference to its edges (called arcs in TopoJSON) allowing redundant shared arcs (between ajacent states or countries) to be reused between objects. Second, the precision of the numbers used to define the arcs and points are compressed using delta encoding (represented as integers rather than floats). Also, the same data can be used to represent a border (mesh) or solid object.
More Resources
When it comes to working with this data, there are so many tools and options. It helps to have a few guideposts for what kind of tools are best suited for the geometry and associated data attributes that you’re trying to present and what kind of principles and practices to lean into and mistakes to avoid. It’s a deep, complex topic, but extermely satisfying to create digital representations of the physical space and data around us.