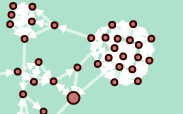
I created a visualization of passages and choices in Ryan North’s excellent chooseable path adventure, Romeo and/or Juliet. With over 100+ endings, nearly 500 passages and close to 1000 choices, it was no mean feat to read let alone visualize the structure of the story in a informative way.
This is the first of a series of posts, in which I’d like to share some of lessons learned and the technical details from how I put this together. First, I’ll share some impressions of the story and and findings from the graph visualization of its structure like how the network of nodes and edges can be used to store the binary state of a puzzle.
R&|J Impressions
Whether you choose to work with Juliet’s sweet muscles vs. Romeo’s smooth talking, there are so many funny and satisfying paths through R&|J. When looking at the graph of passages and choices, there are a couple of interesting facets of the branching narrative that stand out.
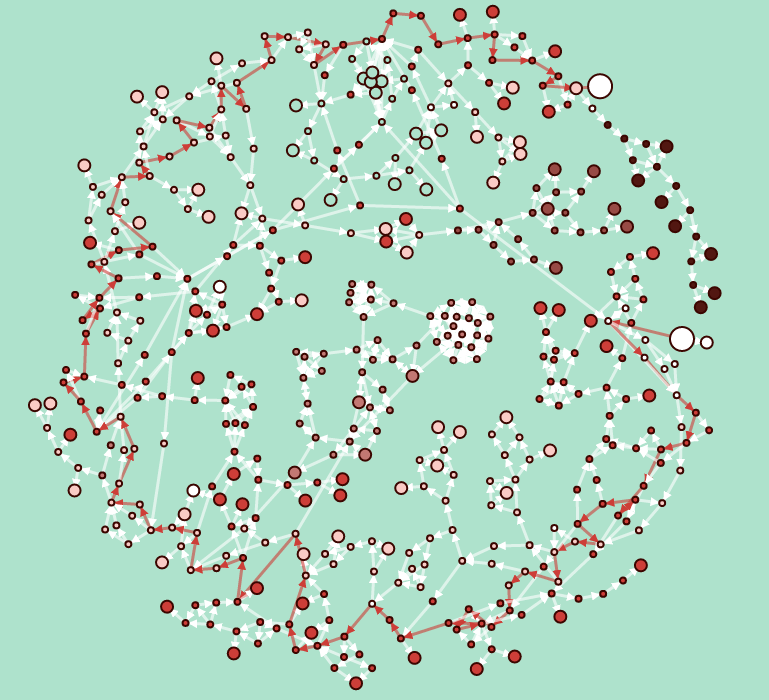
Webs of paths and/or no return choices.
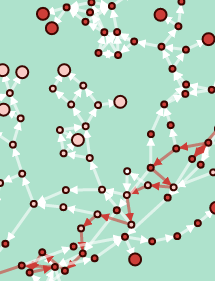
Many of the paths in R&|J are branching webs of varying fanciness that lead to similar possibilities, but there are a few choices that permanently alter the endings that are possible for you, with no return. Some early examples of these choices include Romeo deciding to eating breakfast and Juliet deciding to run away from home and take control of her life. The endings off of these no return choices are just as satisfying if not more so than any of the other endings off of the main path, so its really fun to continue to explore to find these paths.
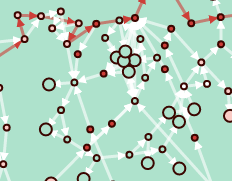
Stored State between passages.
One of the coolest parts of the book has you trying to decode a secret message by adding 0-17 to the each letter’s code (e.g. a = 1. a + 2 = 2 = c, etc.) by flipping switches with values 1, 2, 4 or 8. Because there are 4 switches with 2 possibilities, there are 2^4 (=16) passages which describe the different states of the machine, basically simulating the storage of 4 bits of information. Once you reach the correct state for the machine, the message is decoded and you can choose to proceed in your adventure.
Easy mode and cycles.
Some areas allow you to continue playing from a checkpoint, even if you reach an ending in the story. These appear on the graph as a group of tightly clustered nodes. There’s also at least one point in the game where a story within a story can lead to a kind of infinite recursion of cycles, connecting back to the beginning of the story.
On the next post, I’ll share some information on Data Entry and Sheets Formulas used in this project.
Next up
- Data Entry and/or Data Entry. Exported tab separated values (TSV) files containing Passage and Choice records from reading notes made in Google Sheets.
- Data Processing and/or Graph Theory. Python script to load, transform and export graph data using the Networkx library to JSON nodes and edges.
- Data Visualization and/or Data Visualization. JavaScript, HTML and CSS to render JSON data using D3.JS force directed graph and SVG.