Hey there! My name is Dave.
I am a polyglot full-stack software developer, across programming languages, technical layers, and the organizational stack. I co-founded a long-running weekly software engineering podcast called the Rabbit Hole about learning and growing as a software developer out in the open. You can read more about my other focuses and interests if you're curious.
Here I've shared some writings about my past projects and interests. Feel free to reach out and say
hi!
![]()
Articles
Romeo and/or Juliet
and/or Data Visualization
This is the final part of a series of posts about some of lessons learned and the technical details from how I put together a visualization of passages and choices in Ryan North’s excellent chooseable path adventure, Romeo and/or Juliet. In this writeup, I share some of the code and experiements responsible for the layout and final visualization design.
Click here for the full post.
Romeo and/or Juliet
and/or Graph Theory
I created a visualization of passages and choices in Ryan North’s excellent chooseable path adventure, Romeo and/or Juliet. This is the third part of a series of posts about some of lessons learned and the technical details from how I put this together. This writup focuses on processing the directed graph using Netowrkx in Python to create features to help better visualize the data.
Click here for the full post.
Romeo and/or Juliet
and/or Data Entry
This is the second part of a series of psots about some of the technical details about how I put together a visualization of passages and choices in Ryan North’s excellent choosable path adventure, Romeo and/or Juliet. Here, we talk about designing the schema for the directed graph, gathering data, and some Sheets formulas use to help automate some mundane tasks.
Click here for the full post.
Romeo and/or Juliet
and/or Story Path Analysis
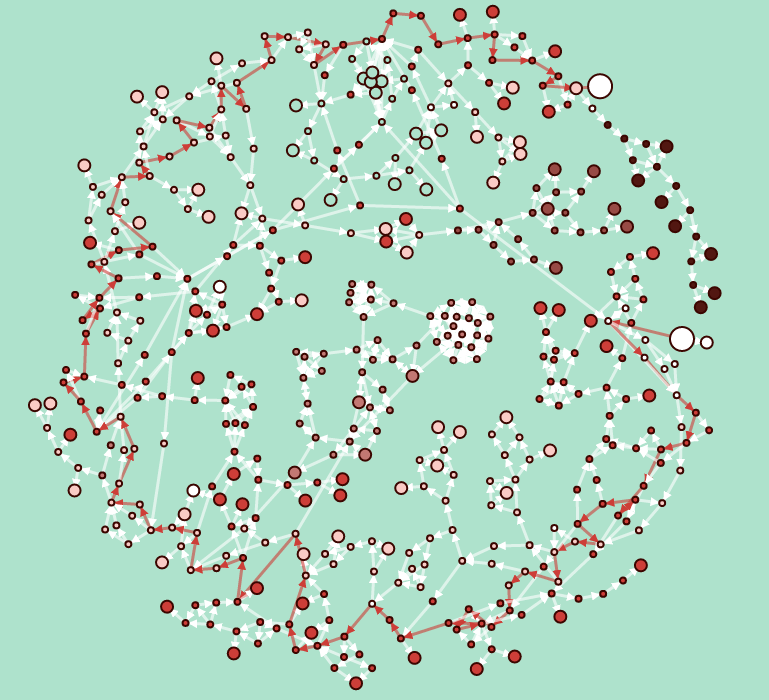
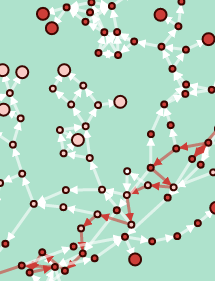
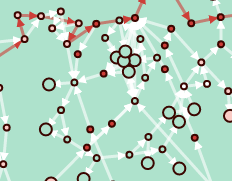
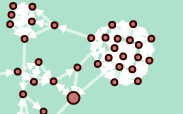
I created a visualization of passages and choices in Ryan North’s excellent chooseable path adventure, Romeo and/or Juliet. With over 100+ endings, nearly 500 passages and close to 1000 choices, it was no mean feat to read let alone visualize the structure of the story in a informative way.
This is the first of a series of posts, in which I’d like to share some of lessons learned and the technical details from how I put this together. First, I’ll share some impressions of the story and and findings from the graph visualization of its structure like how the network of nodes and edges can be used to store the binary state of a puzzle.
Click here for the full post.
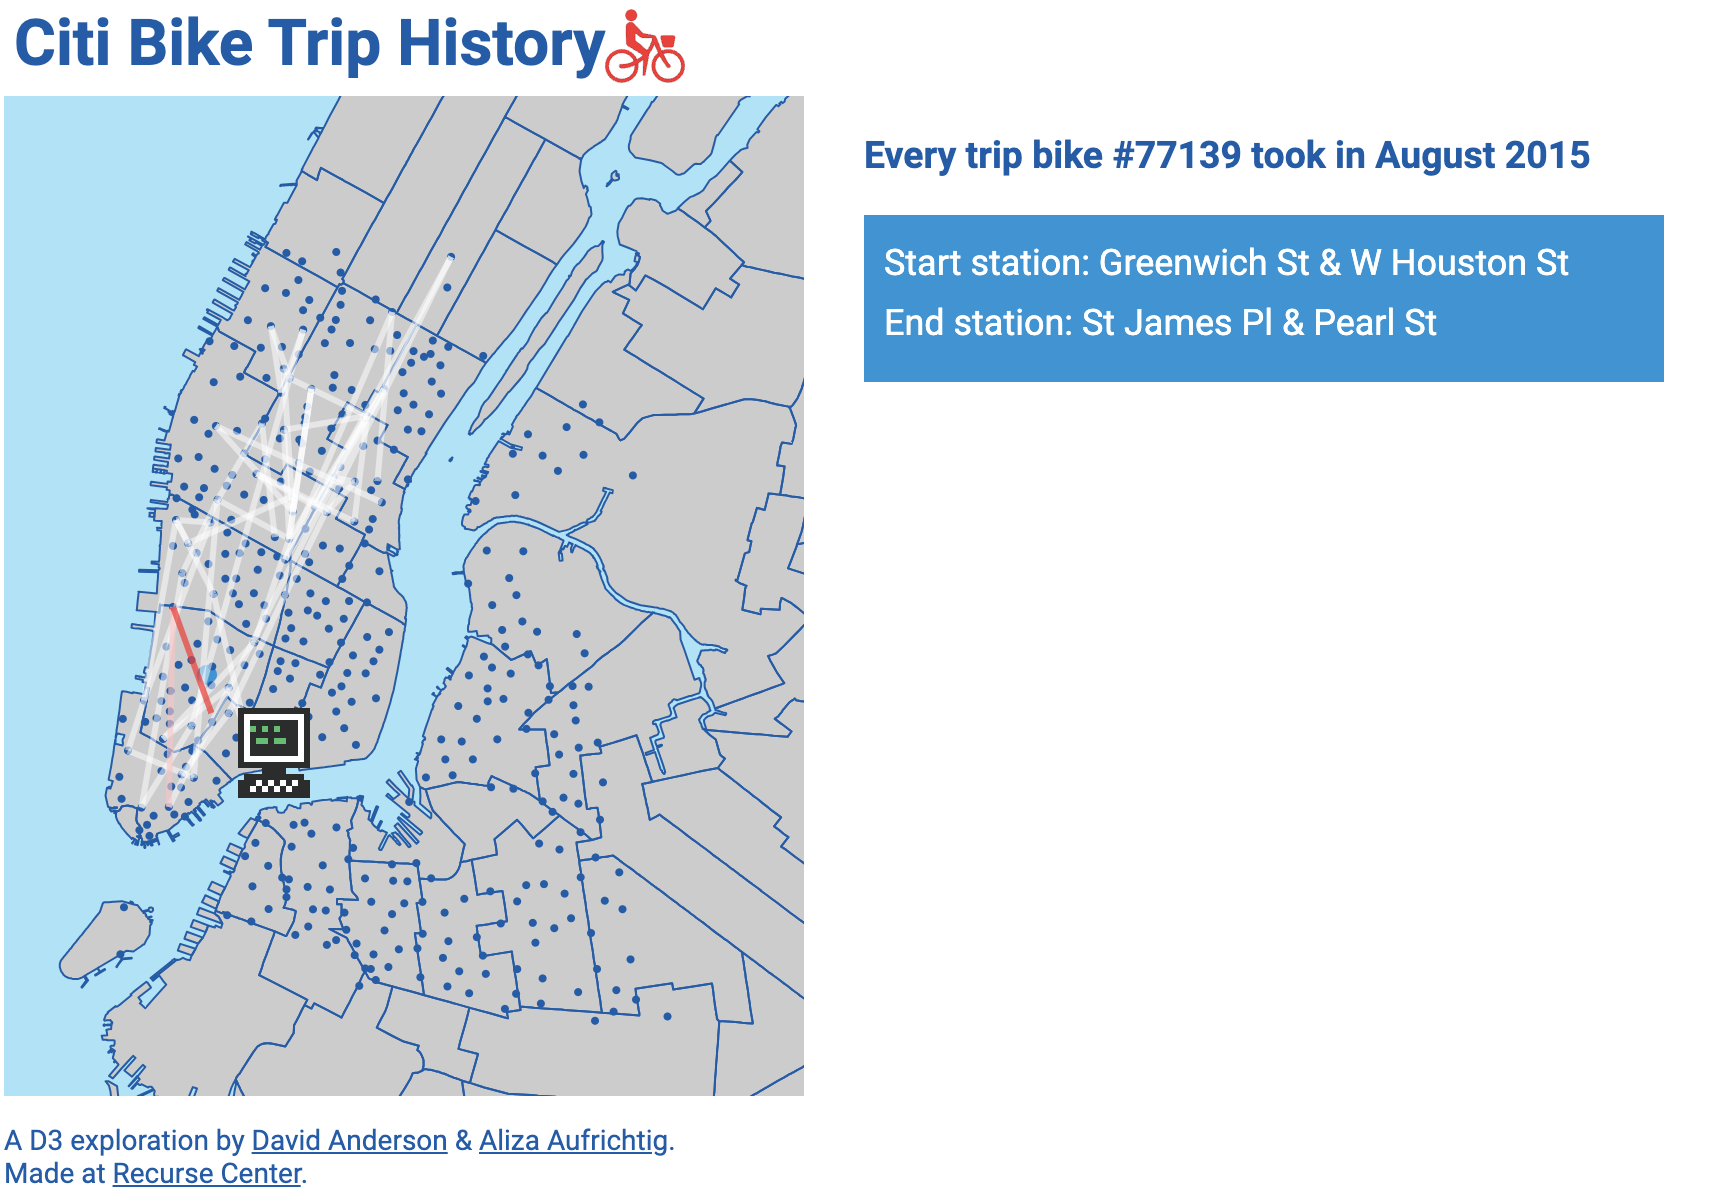
Geometry, Topology and Bikes
I worked through Mike Bostock’s great Let’s Make a Map D3 tutorial with Aliza at Recurse Center as a step on our project to try to render a map of NYC for our CitiBike data visualization.
Click here for the full post.